Tables in Slides: For Data Analysis and Decision-Making
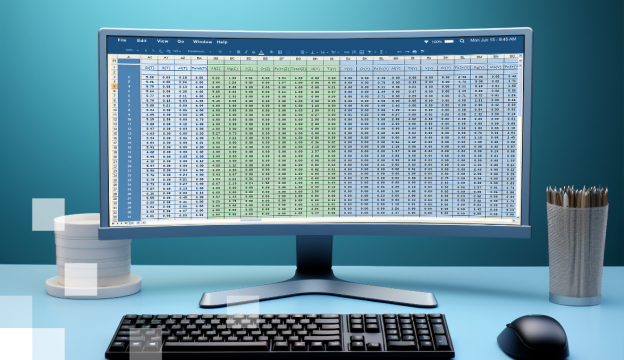
The entire table has been transferred from Excel to a presentation slide, yet the audience is unable to read it, find the data they need, or understand the relationships between the figures. The information is available, but there is simply too much of it, and what matters for decision-making gets lost in the overall volume of data.
People who are accustomed to consuming information in digital environments expect a clear structure and clear indications of what matters most. An overloaded table creates “information noise” and unnecessarily consumes time.
This course develops the skills needed to create effective tables in presentation slides, enabling the audience to easily navigate information, compare data, evaluate available options, and make informed decisions.
As part of the training, you will learn how to define the communication objective of a table, select the data needed for decision-making, and present information in a clear, understandable, and easily digestible way for the audience. In the practical part of the training, you will analyze and redesign tables by applying the knowledge and skills gained during the course.
The training content is based on research and best practices in human perception, attention, and information processing, complemented by principles of UX/UI, instructional design, and presentation design.
For training groups from a single organization, examples and practical exercises can be adapted to the company’s visual identity, including its presentation template, brand guidelines, and actual presentation materials.
Ilze Rassa

Work experience: Ilze has led training sessions for companies, state and international organizations, teaching both individuals and groups. Experience in developing, managing and implementing communication strategies for the President of Latvia, NATO, Statoil Latvia, Rail Baltica and the banking sector. Organized NATO summits, the US President's visit to Latvia, and the Rail Baltica Global Forum.
Recipient of the Cross of Recognition and LASAP "Golden Button" award, member of the Baltic PR Awards jury.
Course Target
Developing the knowledge and skills needed to create relevant, easy-to-read tables for presentation slides while minimizing “information noise” as much as possible
Audience
- Analysts.
- Managers.
- Project managers and finance, sales, HR, procurement, communications, and marketing professionals.
- Consultants and subject-matter experts.
- Anyone who uses tables in presentation slides to summarize results, compare metrics or options, support recommendations, or help the audience make decisions.
- Anyone who is proficient in the technical creation of tables but wants to improve their readability, communication quality, and effectiveness.
At Course Completion you will be able to
- Create clear and well-structured data tables that facilitate evaluation and decision-making.
- Maintain the necessary accuracy and context of the data while reducing information noise.
- Help the audience compare results, options, criteria, and key differences more quickly.
- Reduce the time spent explaining tables during meetings and presentations.
- Use tables to support recommendations and facilitate informed decision-making.
- Create tables that remain easy to understand in remote and hybrid presentations.
- Independently assess when a table is the most appropriate way to present information.
- Apply the knowledge gained when working with any presentation software.
Prerequisites
Basic skills in using a presentation tool such as PowerPoint, Canva, Keynote, or Google Slides. Basic familiarity with tables is desirable, but advanced technical knowledge of PowerPoint or Excel is not required.
The training examples and practical exercises are created in PowerPoint.
Training materials
Training materials, practical examples, and a checklist for evaluating and creating tables prepared by the course instructor.
For group training within a single organization, the organization’s own tables and data examples can be incorporated into the training content, subject to agreement on additional preparation time and costs. Practical exercises can be completed using the organization’s presentation template and in accordance with its visual identity guidelines.
Certification Exam
Not intended.
Course outline
- When to use a table and when it is better to choose a chart or another visualization format.
- How to define the communication objective of a table.
- How to select the information needed for decision-making.
- How to structure rows and columns to make data comparison easier.
- How to use colors, icons, highlighting, and whitespace to improve readability.
- How to reduce “visual noise” without losing the context of the data.
- What research shows about how people perceive and process tables.
- How to transfer data from Excel to PowerPoint and adapt it for presentation purposes.
- Practical table analysis and redesign.
If you want to get more information about this course, please contact us by phone +371 67505091 or send an e-mail at mrn@bda.lv.